一、背景
数据库频繁报错ORA-04030错误,导致应用异常,当出现该错误时会得到类似如下信息
04030: out of process memory when trying to allocate 118808 bytes (QERHJ hash-joi,kllcqas:kllsltba)]
oracle官方对该错误解释:
ORA-04030 out of process memory when trying to allocate string bytes (string,string)
Cause: Operating system process private memory has been exhausted.
Action: See the database administrator or operating system administrator to increase process memory quota. There may be a bug in the application that causes excessive allocations of process memory space.
二、问题分析
这个错误表示操作系统不能分配足够的内存,可能是操作系统上进程内存做了限额,也有可能是BUG导致。
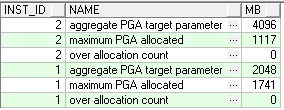
数据库共两个实例,PGA都是采用自动管理的(workarea_size_policy=AUTO).
select inst_id,name,value/1024/1024 MB from gv$pgastat where name in ('maximum PGA allocated','over allocation count');

目前PGA设置并没有存在不合理之处,但为什么频繁出现ORA-04030。检查数据库服务器/etc/security/limits,
部分信息如下:
* Attribute Value
* ========== ============
* fsize_hard set to fsize
* cpu_hard set to cpu
* core_hard -1
* data_hard -1
* stack_hard 8388608
* rss_hard -1
* nofiles_hard -1
*
oracle:
data = -1
stack = -1
可以看到,虽然oracle用户的stack设置为ulimited,但stack硬限制为8388608KB,导致oracle用户进程的栈的最大值受到限制,但目前stack也有8G,问题关键可能不在这里。
检查记录应用执行情况的相关表,里面有大量和ORA-04030有关的信息如下:
ORA-04030: out of process memory when trying to allocate 120 bytes
(kxs-heap-w,x$ksmsp)
主要是查询v$ksmsp导致的。
试着在服务器(实例2)执行了下面操作:
SQL> conn /as sysdba
Connected.
SQL> select * from v$ksmsp where rownum=1;
ADDR INDX INST_ID KSMCHIDX KSMCHDUR KSMCHCOM
---------------- ---------- ---------- ---------- ---------- ----------------
KSMCHPTR KSMCHSIZ KSMCHCLS KSMCHTYP KSMCHPAR
---------------- ---------- -------- ---------- ----------------
0000000118705FF0 0 2 7 4 KGH: NO ACCESS
07000006B7FF7FE0 32800 no acce 0 00
SQL> exit
Disconnected from Oracle Database 10g Enterprise Edition Release 10.2.0.4.0 - 64bit Production
With the Partitioning, Real Application Clusters, Data Mining and Real Application Testing options
cwgkp19b1[/home/oracle]sqlplus landingbj/landingbj@landingbj
SQL*Plus: Release 10.2.0.4.0 - Production on Thu Feb 9 11:14:54 2012
Copyright (c) 1982, 2007, Oracle. All Rights Reserved.
Enter password:
Connected to:
Oracle Database 10g Enterprise Edition Release 10.2.0.4.0 - 64bit Production
With the Partitioning, Real Application Clusters, Data Mining and Real Application Testing options
SQL> select * from v$ksmsp where rownum=1;
select * from v$ksmsp where rownum=1
*
ERROR at line 1:
ORA-04030: out of process memory when trying to allocate 120 bytes
(kxs-heap-w,x$ksmsp)
结果很奇怪,通过listener执行会出现ORA-04030,而不通过listener不会报错。又执行了多次,问题依旧,然后在cwgkvpd1执行,结果一样。
觉得好奇,通过下面语句检查select * from v$ksmsp where rownum=1的PGA消耗情况:
Select a.NAME,b.VALUE
From v$statname a,v$sesstat b
Where a.STATISTIC#=b.STATISTIC#
And a.Name Like '%pga%'
And b.SID=363
NAME | VALUE |
session pga memory | 659448 |
session pga memory max | 116461560 |
多次测试观察现象表明当某session的PGA占用达到100多M时就会报ORA-04030。
通过metalink的ORA-04030 When Clients Connect Across Network Using SQLNet [ID 753439.1]找到了答案,里面有这样的描述
You may see the one or more of the following scenarios:
- Alert log shows error ORA-04030 when connecting remotely using SQL*Net:
ORA-04030: out of process memory when trying to allocate 258072 bytes (QERGH
hash-agg,kllcqas:kllsltba)
- Local connection works without any errors and user process is using about 142 MB of PGA for the session.
- Increased the parameter pga_aggregate_target to 5G or more but the error still occurs:
ALTER SYSTEM SET pga_aggregate_target='5000M' SCOPE=SPFILE SID='*';
- A heapdump shows a user process is using about 100M of PGA for the session when connecting via SQL*NET which is less than the memory used during local connection.
event= '4030 trace name heapdump level 536870917;name errorstack level 3'
Cause
1. The problem is identified as the listener has started up with crs_start or srvctl.
Srvctl or crs_start (which is not supported) uses lsnrctl start command to start the listener.
Srvctl is a wrapper script written to start the listener. Consider it like a shell script.
From 11.2, if you install Grid for ASM and use srvctl to administer the TNS listener
then you might hit this issue.
Please note that this has nothing to do with RAC or Clusterware.
This is not an Oracle memory resource issue since connecting via SQL*Net is using less PGA for the session than a local connection which is successful.
2. If the listener is being started automatically, then we will inherit the limits of the user who started the process (root). If the root user is given the same ulimits as the oracle user, the problem should go away as when the listener autostarts on boot (root user privs), it will start with the correct ulimits.
在服务器使用本地连接,即使会话占用PGA达到142M也不会报错,但是如果通过listener,即使pga_aggregate_target设为5G或更多,会话的占用PGA较大时仍然会报错。即使在服务器上将/etc/security/limits里oracle涉及指标改为ulimited,问题仍然出现。而导致的原因是用crs_start or srvctl启动的listener,它和直接用lsnrctl start并不一样,做了一次封装。上面描述和我们遇到的情况极其类似,那么是否有该原因引起,metlink给出的解决方案:
Solution
As a workaround:
1. Stop the listener and start it with lsnrctl
2. Stop and start the listener as the oracle user so it gives the listener the oracle ulimits.
停止监听,然后用lsnrctl start启动监听器,在启动后,listener出现The listener supports no services,这属于正常现象,因为目前采用的是动态注册方式(status READY),需由PMON动态注册或用alter system register;,过一分钟再执行lsnrctl status,出现The command completed successfully。
通过listener登录执行select * from v$ksmsp where rownum=1;,此时并没有报错了,应用恢复正常,问题解决。
参考文档
1、ORA-04030 When Clients Connect Across Network Using SQL*Net [ID 753439.1]
2、Ora-04030 While Running a query from a remote client [ID 266219.1]


 技术讨论
技术讨论